Trap integrity modelling and calibration in faulted sedimentary basins
Quantiseal is a method for predicting the hydrocarbon trapping ability of potential seals in interbedded and faulted sequences in the sub-surface.
The use of this methodology over the last 15 years in the oil and gas industry has resulted in better definition of risks and tighter ranges on hydrocarbon volume estimates in exploration, appraisal and development programs. It has led to decisions where drilling progressed on higher graded prospects that resulted in discoveries, and to decisions where drilling programs were abandoned.
Better risk and volumetric definition adds value
Quantiseal analysis is relevant to oil and gas exploration and development, carbon capture and storage and groundwater aquifer evaluations.
The problem addressed
The Quantiseal software and methodology addresses one of the major problems in the oil and gas industry.
Well failure analysis results from 55 wells in the Gippsland Basin show that seal related issues account for 56% of well failures. In addition to top, base and fault seal, seal effectiveness also impacts trap geometry particularly in interbedded sequences (which seal is sealing?) and migration (what seals are migration surfaces and which fault sections allow migration?).

Expected reserves outcomes are often not realized through significant drilling programs, with major commercial consequences. In a nine well program in the Gippsland Basin in the 1990’s, the post drill volumes discovered was one tenth of the predrill risked reserves. Post well analysis showed that a poor understanding of fault seal related issues was a major contributing factor.
Background
The first application of Quantiseal technology was in the Gippsland Basin Australia, where the method was developed. In this basin there is a large public dataset available comprising hundreds of wells. With numerous reservoir-seal pairs intersected in each well, there is data on many hundreds of working and failed fault seals. This data provides an excellent base for research into the controls on fault trapping and has been the basis for developing the Quantiseal methodology and software for predictive modelling.
Interbedded lithologies in the Gippsland Basin comprise sandstones shales, mudstones, siltstones, coals and marls. Depositional facies vary from fluvial to coal-swamp to marine. Calibrated models are in normal to slightly geopressured settings. The present-day stress tensor determined from petroleum data suggests a borderline strike-slip/reverse regime and a northwest–southeast SHmax orientation.
The Quantiseal method has also been used successfully in other basins around the globe including the Otway, Carnarvon, Browse, Bonaparte in Australia, the Santos Basin in Brazil and the Tumbes and Maranon basins in Peru.
How it works
The method tests the seal potential of all elements of a fault model, (trap seal elements) comprising host rock, damage zone, fault core gouge and smear fault rocks, and incorporates, with fault development the presence of through going slip planes.
The key findings of the analysis are;
- Subtle changes in lithological composition of seal candidates has a major influence on the effectiveness of faulted seals.
- Cross-fault juxtaposition of seals is the main control on fault trap development where seal quality is adequate, (as dictated by calibrated lithotype ranges determined from a large and growing data set).
- Smear and shale gouge, variably developed, play a much smaller role than juxtaposition and may extend the effective seal in the fault zone. This varies depending on lithification level and lithotypes present (based on the hundreds of reservoir seal pairs calibrated to date).
Calibration is everything!
The best quantitative way to develop predictive fault models in sedimentary basins is to demonstrate a match of a calibration model to actual hydrocarbon and water sands distribution in existing nearby relevant faulted fields. As fault traps can leak for a wide range of reasons and leak points can be very localized and unable to be resolved/sampled with current technologies, field calibration provides the highest level of calibration.
If the calibration model matches the positions and column heights of trapped hydrocarbons and explains fill type in each reservoir, then there is a good quantitative basis for developing predictive models for nearby or analogous targets.
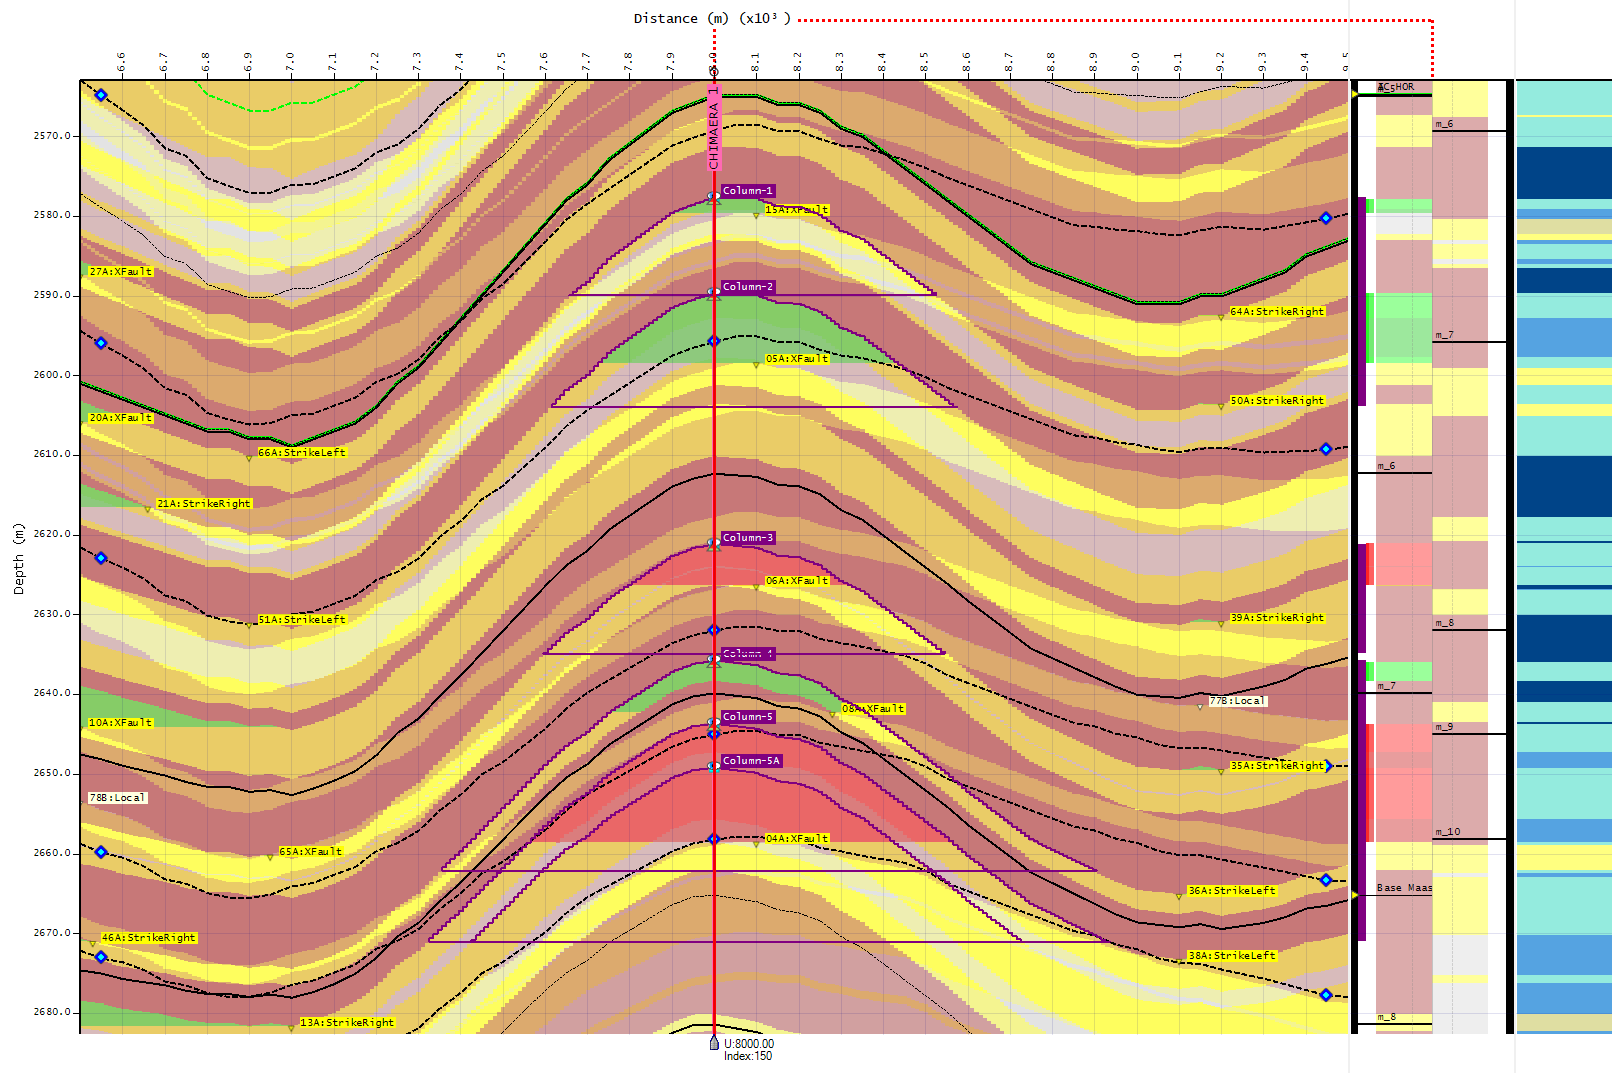
Manta field calibration example
The Manta field is a good example of the calibration level that can be achieved with this methodology. It is one of numerous calibration exercises carried out in the Gippsland and other basins with similar results.
The Manta field comprises a series of stacked oil and gas pools trapped in a downside faulted plunging anticline. The well is close to the fault, minimizing the probability of stratigraphic variation. The reservoir sequence comprises interbedded sands, shales, siltstones and coals. There is syndepositional growth on the fault as the hydrocarbon bearing interval thickens into the basin.
Pressure data is available in the hydrocarbon and water bearing reservoirs, defining the free water levels. Wireline and lithology data is also available. There are both oil and gas columns presented as identified from pressure measurements and sampling and petrophysical interpretation.

In the Quantiseal calibration process a Seal Index profile is generated for the calibration well(s). This data is integrated with seismic depth data describing the horizon profiles on either side of the fault using Allan diagrams. Dip spill data away from the fault at each mapped horizon is also incorporated. All these components are integrated in the software to generate a pseudo 3D model.
To achieve a calibration, adjustments can be made to the many variables involved in the 3D model to generate a best fit model. Fault throws can be adjusted within the seismic error bar range. Seal quality cut-off values can also be adjusted and the impacts of different fault sealing mechanisms (e.g. via juxtaposition, smear or gouge) in the fault zones can be tested in the calibration model to find the geologically reasonable best fit solution.
In the model below the assumptions are that trapping occurs by cross-fault juxtaposition where seal quality is adequate and that some smear occurs on the better-quality seals. Cut off values for seal adequacy in the damage zone are established from other field calibrations and are further tested/refined in this calibration model.

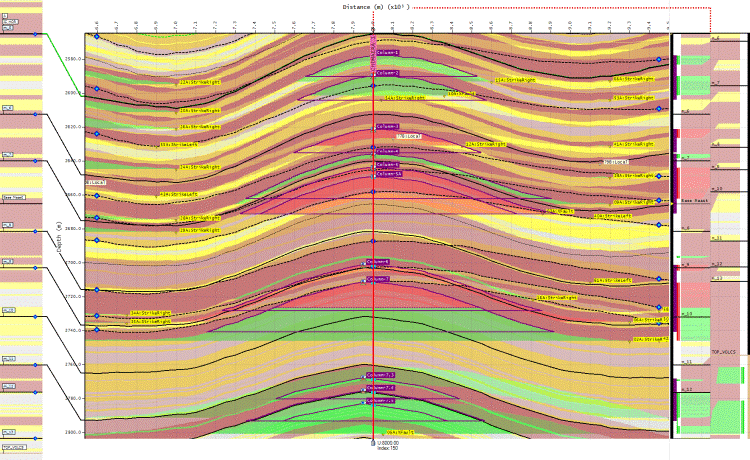
In this calibration model the fill type for each sand is matched by the calibration model, i.e. every water and hydrocarbon bearing sand is explained. The model hydrocarbon column heights are a close match with the column heights determined from pressure measurements.
In this case, the juxtaposition of the better-quality seals is the primary control on trapping, with some smear on the better-quality seals contributing to a better match with the hydrocarbon column heights.

Detailed investigation of the model shows that in Oil Column 2, the upper and lower oil bearing sands are part of the same accumulation with pressures in both sands lying on an oil gradient consistent with the density of the oil recovered. This means that the intervening shale is not sealing near the fault (in the fault damage zone).
This provides positive feedback in the calibration process that the seal quality cut off levels for seals in the damage zone are set at the correct levels. The presence of a poorer quality seal with a hydrocarbon column is also interpreted to be occurring in Oil Column 1 where the effective seal is above the shallower thin tight sand.

Deeper in the section Oil and Gas columns 3, 4 and 5 show a similar match. Hydrocarbon column 3 is gas and is in a simple juxtaposition trap. Hydrocarbon column 4 is oil and clearly separated in the model from gas columns above and below. Hydrocarbon columns 5 and 5A are gas in three sands separated by poorer quality seals. The upper column 5 sand has a gas pressure slightly lower than the gradient line in the lower two sands as measured in Manta-1. In Manta-2 the pressures in these sands lines up on the same gradient. This is consistent with the seal model that indicates that the gas in these reservoir sands are in communication via poorer quality damage zone permeable intervals.
Other seal models tested at Manta
Juxtaposition with no smear model
This model assumptions are that there is no smear component operating and that sealing is via cross-fault juxtaposition where seal quality is adequate (seal differentiation).
The result is a poorer match to actual columns with model columns less than the actual observed columns.

Juxtaposition with all potential seals working plus smear
In this model the damage zone cut off values are set to zero allowing all seals to be effective across the fault.
The result is a poor match to actual columns with model columns greater than the actual observed columns.

Shale gouge model
In this model it is assumed that a gouge layer is uniformly developed of the fault plane and that all potential seals work away from the fault.
The result is a poor match to actual columns with model columns much greater than the actual observed columns with all sands hydrocarbon bearing.
Numerous combinations of parameters can be generated with sensitivities run on all variables. Outputs can be used to constrain deterministic or stochastic forward models of targets. Digital outputs include listings of all model column parameters showing column heights and leak point depths and positions as well as petrophysical and lithologic properties of the effective and failed seals.
Forward Modelling
Once calibrations models are established then new targets can be better assessed. Ranges on key parameters are well constrained and stochastic estimates result in a more quantitative analysis.
Brazil Prospect predictive model

This prospect is located on the faulted flank of a salt diapir in the Santos Basin in Brazil. Offset wells were located within a few km on either side of the prospect. The top seal comprised a thick section of marine shale with thin sand stringers and carbonate beds. Up dip seal is provided by the salt wall. Large radial faults around the diapiric structure dissect the structures around the salt body and limit the extent of the prospect. Large fault dependent closures are present.
Pre-drill results show a model hydrocarbon column about half the height of the fault controlled closure. The model column height is controlled by the reservoir being juxtaposed against and leaking through thin sand stringers and poor-quality units within the top seal damage zone. The model FWL is controlled by the level of the dip closure of the thin sand unit within the top seal.
The fault model here involves juxtaposition of better quality seals as the main mechanism with some smear improving the match to actual hydrocarbon column height.


Post well data shows a close match of hydrocarbon column height with the P50 value of the model. The P50 model value was determined from simulation runs varying fault throw in line with seismic error ranges and bed stratigraphic continuity ranges.
Numerous case studies
Comparable results have been achieved in numerous studies around the world.
Assessments completed to date;
- Gippsland Basin – 42 wells, field calibrations, exploration and development models.
- Otway Basin – 8 wells, field and well calibrations.
- Maranon Basin Peru – 38 wells, well calibrations and basin wide seal quality mapping.
- Tumbes Basin Peru – 7 wells, well calibration and prospect evaluations.
- Santos Basin Brazil – 31 wells, field calibrations and prospect evaluations.
- African basins – 7 wells, well and field calibration.
- Browse Basin – 9 wells, field calibrations, prospect evaluations.
- Carnarvon Exmouth Basins – 27 wells, well calibrations.
- Bonaparte Basin – 17 wells, field calibrations and prospect evaluations
With these projects, many hundreds of potential seals have been evaluated. What has been learnt from these studies has been used to improve and refine the methodology and software in ongoing cycles of refinement.
Applications
This method works best in faulted stratigraphy complex interbedded marine and non-marine sections. This includes coaly facies and intervals with volcanics, settings in which the method was initially developed.
Applications include;
- Exploration or appraisal faulted prospect evaluation
- Producing or developed field fault sealing and non-sealing hydraulic studies.
- CCS site evaluation and monitoring in faulted settings
- Seal quality mapping, in permit or basin wide, where quantitative mapping of the distribution of effective fault seals provides a guide to optimal areas of prospectivity.
In simple cases involving a faulted thick good-quality seals above a reservoir and the spill level matches closely with the FWL, the application of the methodology is usually unnecessary. With the increasing level of maturity of oil and gas exploration world-wide, these circumstances are increasingly harder to find. More hydrocarbons are found in more challenging settings and require more sophisticated technology to commercially exploit.
What data is required?
This methodology was designed around commonly available oil and gas industry data sets. The basic data requirements to carry out modelling comprise;
- Wireline petrophysical data; Gamma ray, Caliper, Resistivity, Sonic, Neutron, Density, Drho.
- Mud log, composite log, petrophysical interpretation log. Well Completion Reports
- Formation pressure data, including RFT data that defines water and hydrocarbon bearing zones.
- Depth maps at multiple horizons and fault polygons.
- Sufficient data, geological or geophysical to determine fault history